PU Prime App
Exclusive deals on mobile


PU Prime App
Exclusive deals on mobile
Nắm giữ thị trường toàn cầu trong tay bạn
Ứng dụng di động giao dịch của chúng tôi tương thích với hầu hết các thiết bị thông minh. Tải xuống Ứng dụng ngay bây giờ và bắt đầu giao dịch với PU Prime trên mọi thiết bị, mọi lúc, mọi nơi.


20 February 2024,02:06
Daily Market Analysis
20 February 2024, 02:06


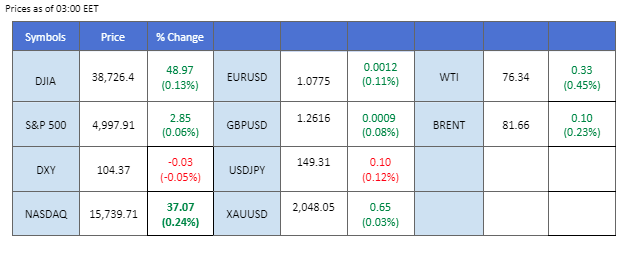
Oil prices surged by over 3% yesterday, driven by escalating tensions in the Middle East. Ceasefire talks took a gloomy turn as Israeli Prime Minister Benjamin Netanyahu rejected the Gaza deal, deeming it “delusional.” This geopolitical uncertainty in the Middle East also fueled demand for the safe-haven asset, gold. Meanwhile, the U.S. dollar maintained strength above the $104 level, supported by robust economic performance in the U.S. and consistent hawkish comments from various Fed officials. Additionally, BTC prices surpassed $45,000 for the first time since the SEC approved the BTC ETF. The initial “sell on news” sentiment waned, and demand for BlackRock and Fidelity ETFs bolstered the largest cryptocurrency.
Current rate hike bets on 20th March Fed interest rate decision:
Source: CME Fedwatch Tool
0 bps (82%) VS -25 bps (18%)
(MT4 System Time)
Source: MQL5
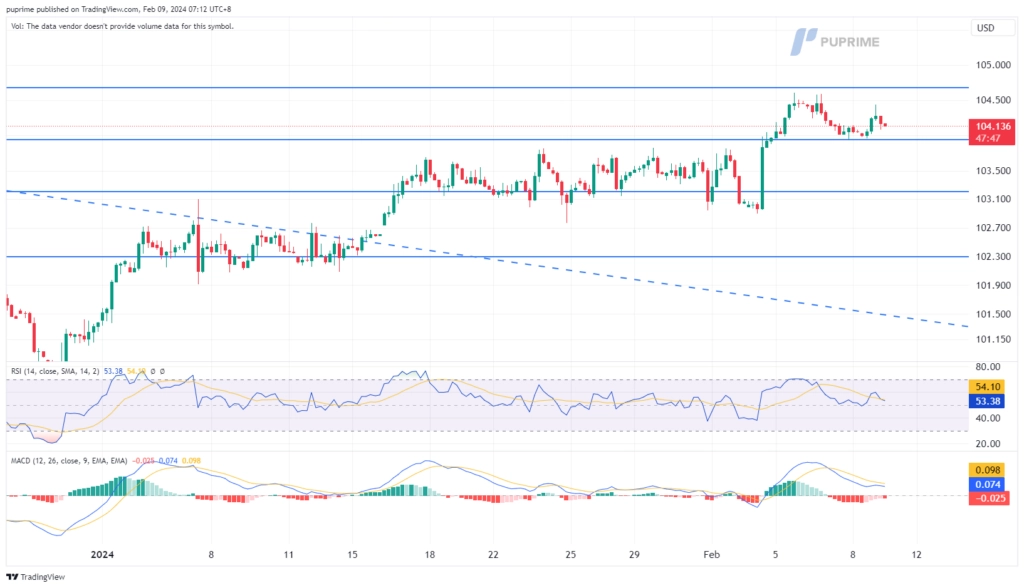
The Dollar Index maintains its position above the 104 level, signalling the continuity of bullish momentum. With increasing speculation that the Fed may sustain elevated interest rates for an extended period to curb inflation, the shift in market sentiment propelled the dollar to higher levels yesterday. The forthcoming economic data, particularly the Consumer Price Index (CPI) and Retail Sales figures, are anticipated to be crucial factors influencing the index’s price movements.
The Dollar Index remains trading at above 104 trajectories, suggesting a continued bullish bias for the index. The RSI remains hovering in the upper region while the MACD slides but is on the brink of crossing before breaking below the zero line, suggesting a bullish momentum may be forming.
Resistance level: 104.67, 105.70
Support level: 103.85, 103.20
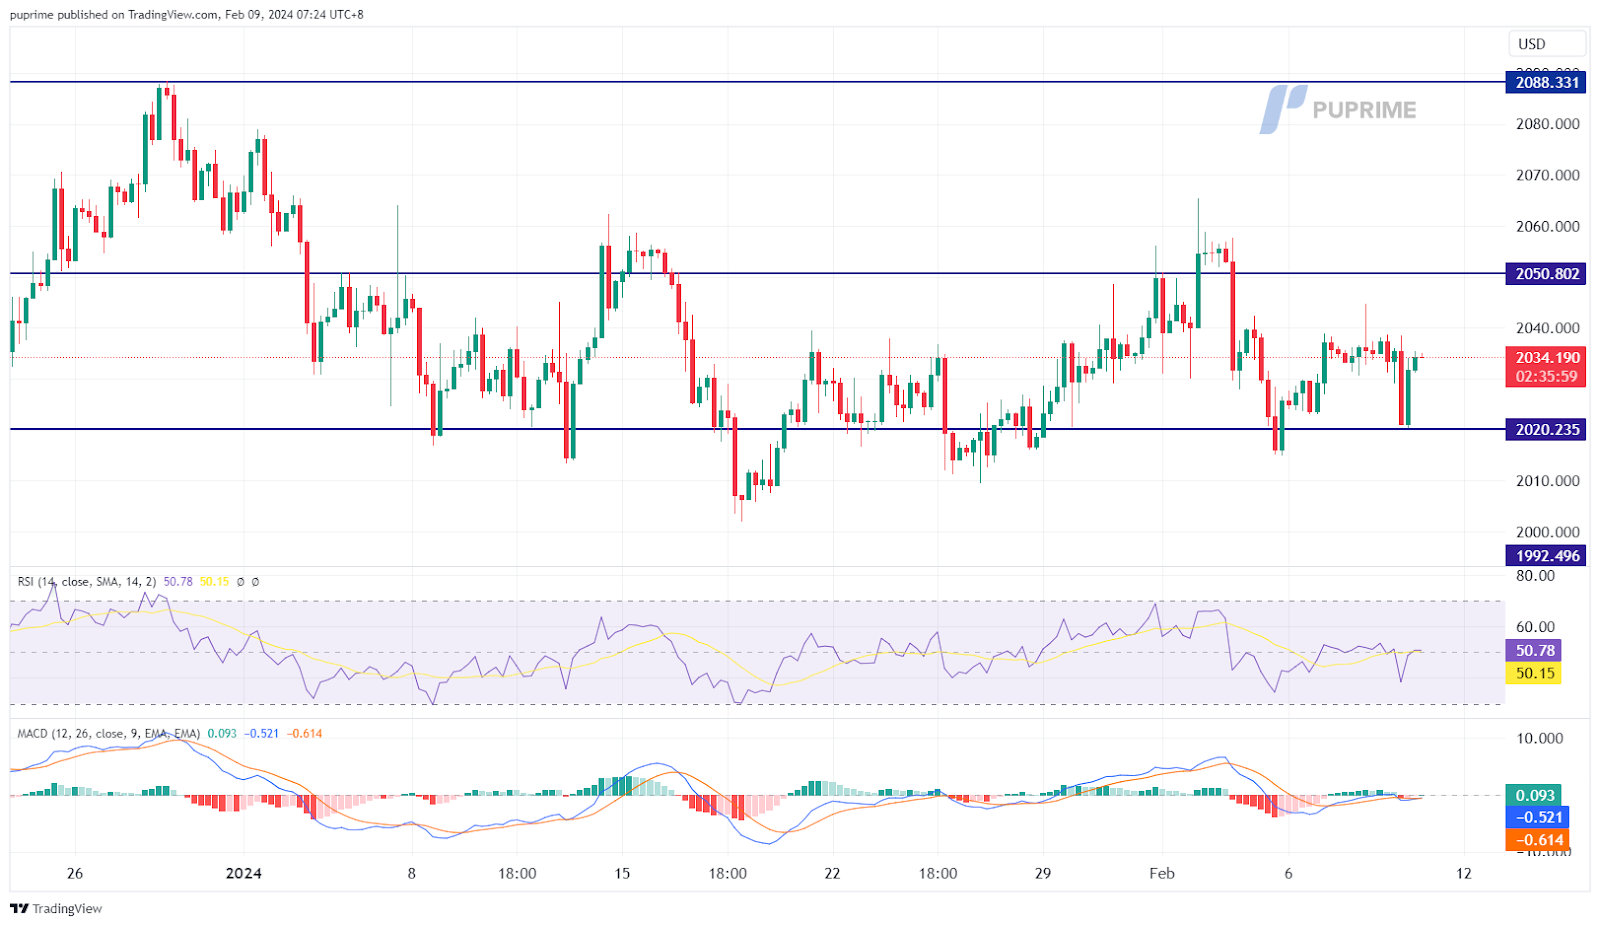
Gold prices exhibited a wide range of fluctuations last night, responding to shifts in market sentiment. Initially impacted by a strengthened dollar amid a more hawkish outlook for the Fed’s monetary policy, gold experienced volatility. However, the dynamics changed with a reversal in the ceasefire talks related to Middle East tensions, leading to renewed demand for the safe-haven commodity.
Gold prices fluctuate widely but remain sideways and have not picked a direction. The RSI has been flowing near the 50 level while the MACD is hovering near the zero line, giving a neutral signal for the gold.
Resistance level: 2050.00, 2088.00
Support level: 2020.00, 1992.00

The GBP/USD lost its bullish momentum after experiencing a strong technical rebound from recent lows. The U.S. initial jobless claims, reported at 218k, came in lower than the previous reading, suggesting that the job market in the U.S. remains robust. This development fueled strength in the dollar and exerted pressure on the sterling.
GBPUSD is hovering near its crucial pivotal level at 1.2620 level, with wide fluctuation near such a level. The RSI gain from near the oversold zone while the MACD moves upward and approaches the zero line from below suggests a bullish momentum may be forming.
Resistance level: 1.2710, 1.2785
Support level:1.2610, 1.2530
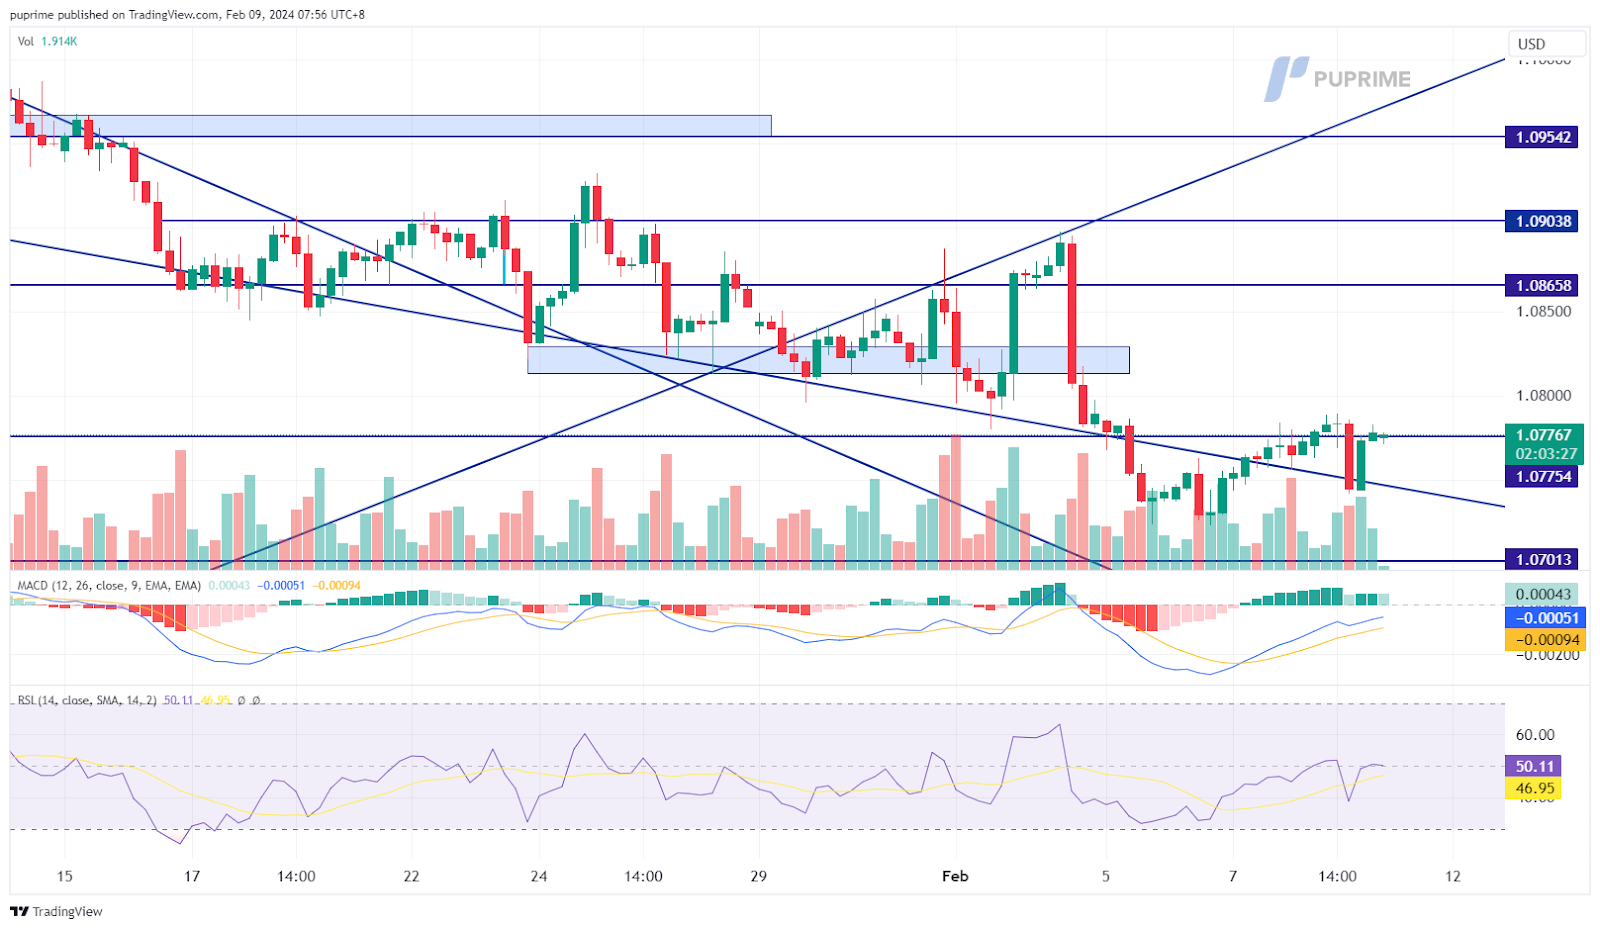
The EUR/USD struggled to maintain its position around the pivotal level of 1.0775. The growing monetary policy divergence between the ECB and the Fed is anticipated to exert strong downward pressure on the euro. The lacklustre economic performance in the eurozone has led to speculation that the ECB might consider an early rate cut to prevent a market recession, further softening the euro.
The EUR/USD sawawed in the last session and is currently trading near its crucial pivotal level at 1.0775. The MACD continue to gain and is approaching the zero line while the RSI rebounding to near the 50 level suggest a bullish momentum might be forming.
Resistance level: 1.0866, 1.0954
Support level: 1.0700, 1.0630
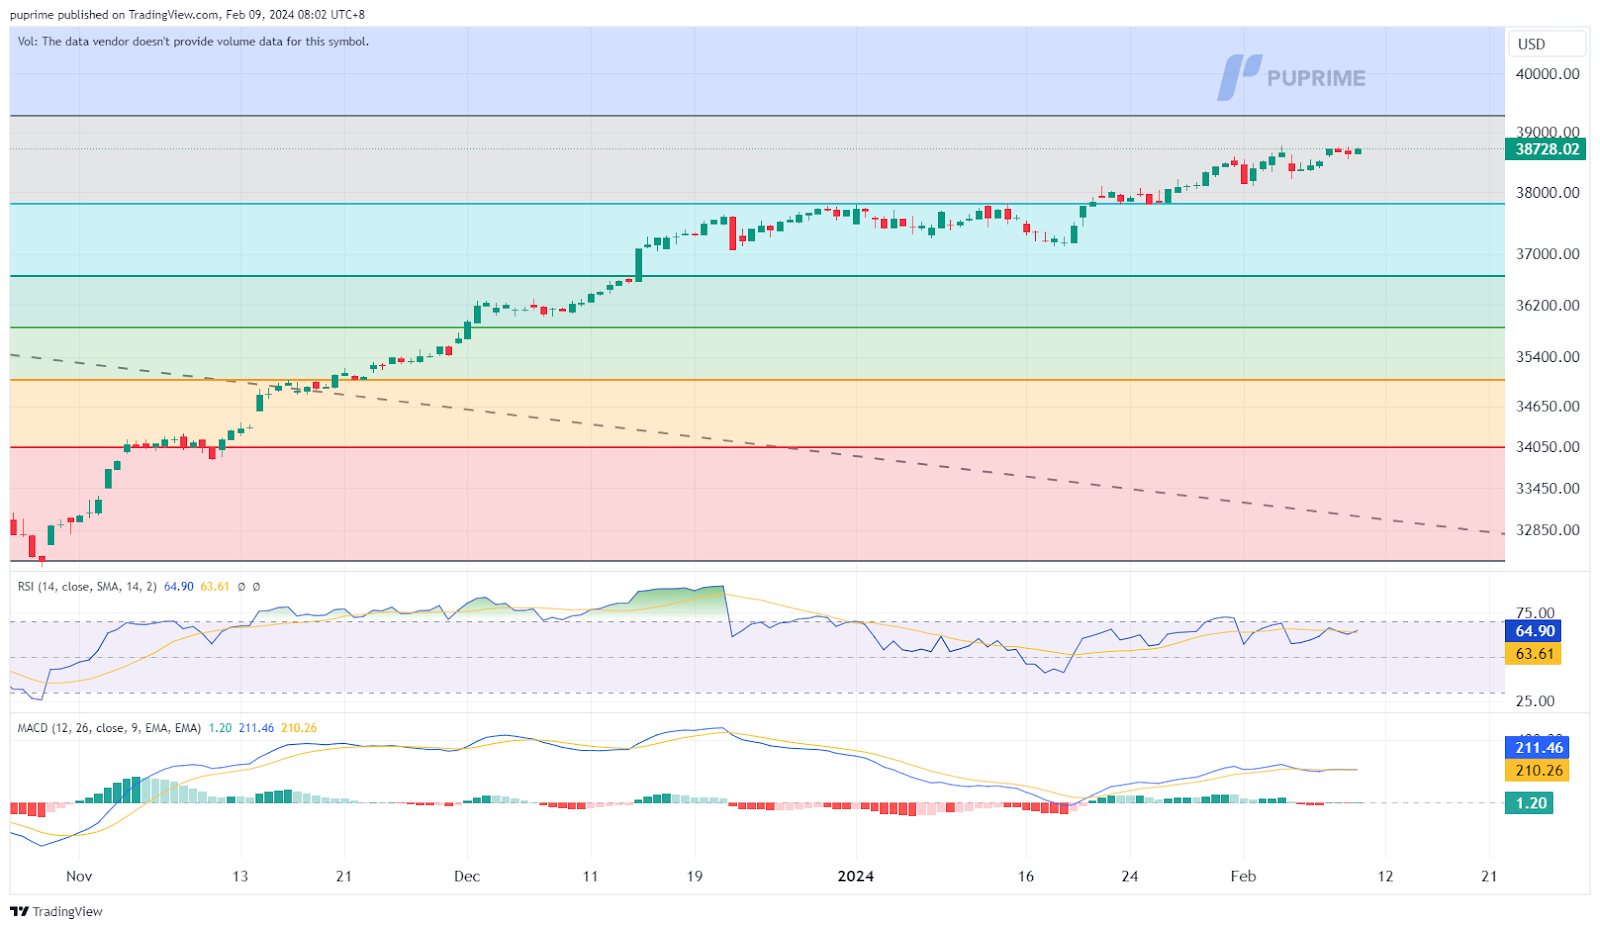
The US equity market continues its upward trajectory, although the bullish momentum appears to be easing in response to a shift in market sentiment. The latest economic indicators, particularly the job data, such as Initial Jobless Claims, suggest that the US job market remains resilient. This could influence the Federal Reserve to maintain the current elevated interest rate level for an extended period to address inflation concerns. A prolonged period of monetary tightening may pose challenges for the equity market to sustain higher gains.
Dow Jones is trading higher following the prior breakout above the resistance level. The RSI remains flowing in the upper region while the MACD hovers flat above the zero line, suggesting the index remains trading with strong bullish momentum.
Resistance level: 39280.00, 40000.00
Support level: 37815.00, 36660.00
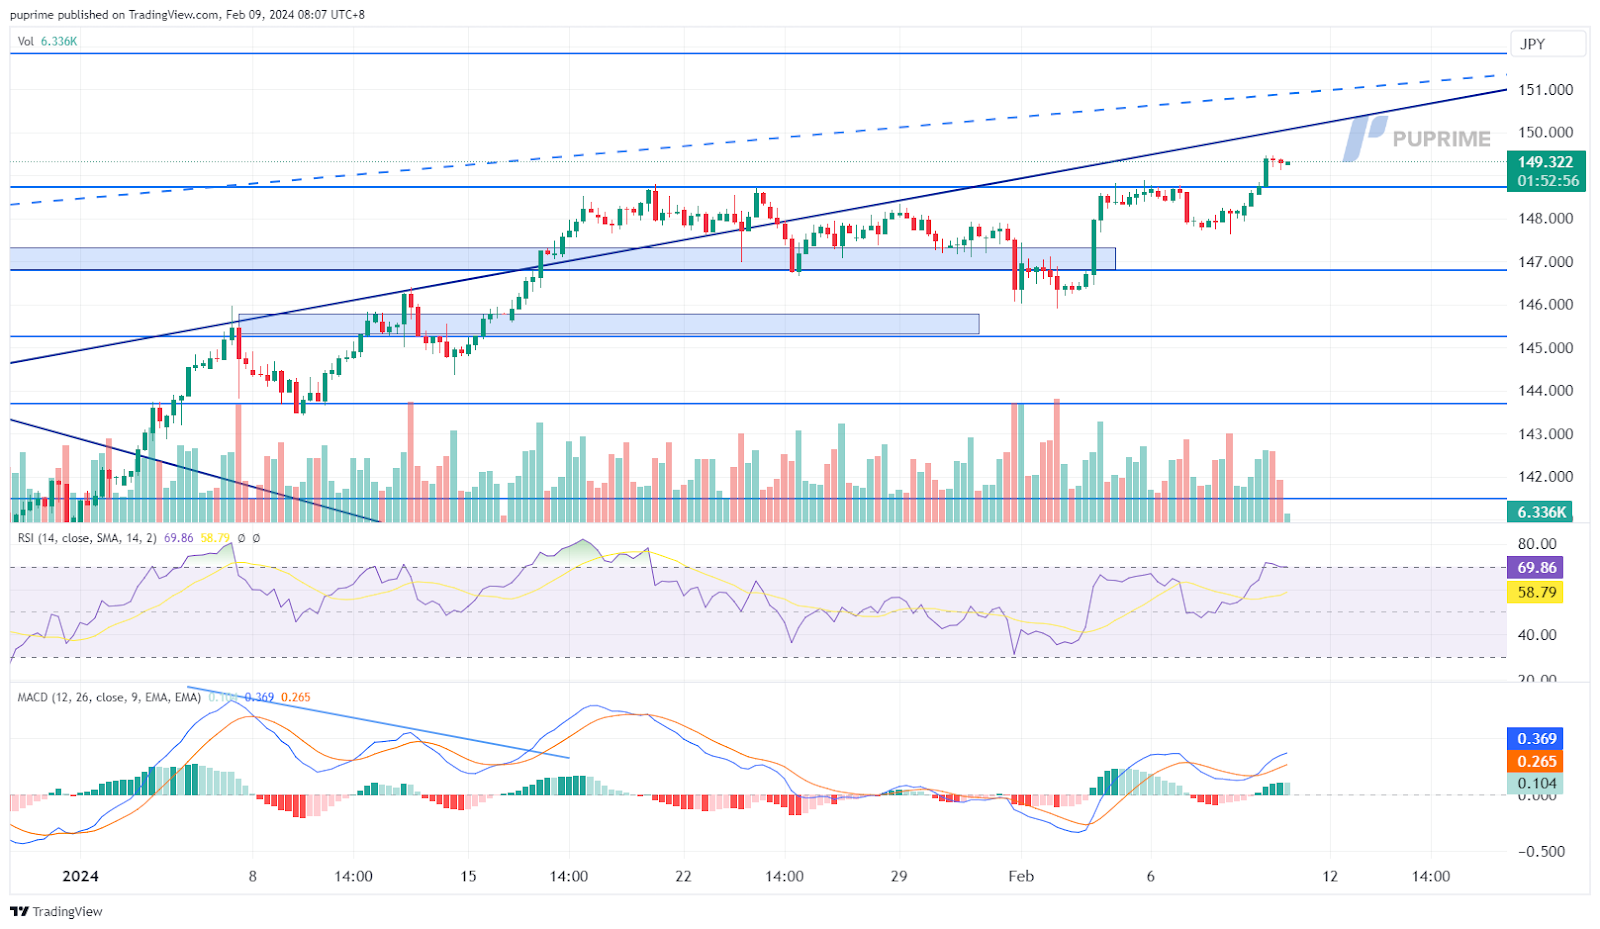
The USD/JPY pair has successfully breached its critical resistance level at 148.72, indicating a bullish bias for the pair. The Japanese Yen remains weak compared to other currencies, with the Japanese authorities facing a dilemma in shaping their upcoming monetary policy amidst subpar economic performance. Meanwhile, the US dollar continues to strengthen, fueled by positive economic data and hawkish comments from Federal Reserve officials.
The pair has broken above its strong resistance level at 148.72, suggesting a bullish signal for the pair. The RSI has broken into the overbought zone while the MACD crossed and moved upward, suggesting the bullish momentum is strong with the pair.
Resistance level: 151.80, 154.65
Support level: 148.72, 146.80
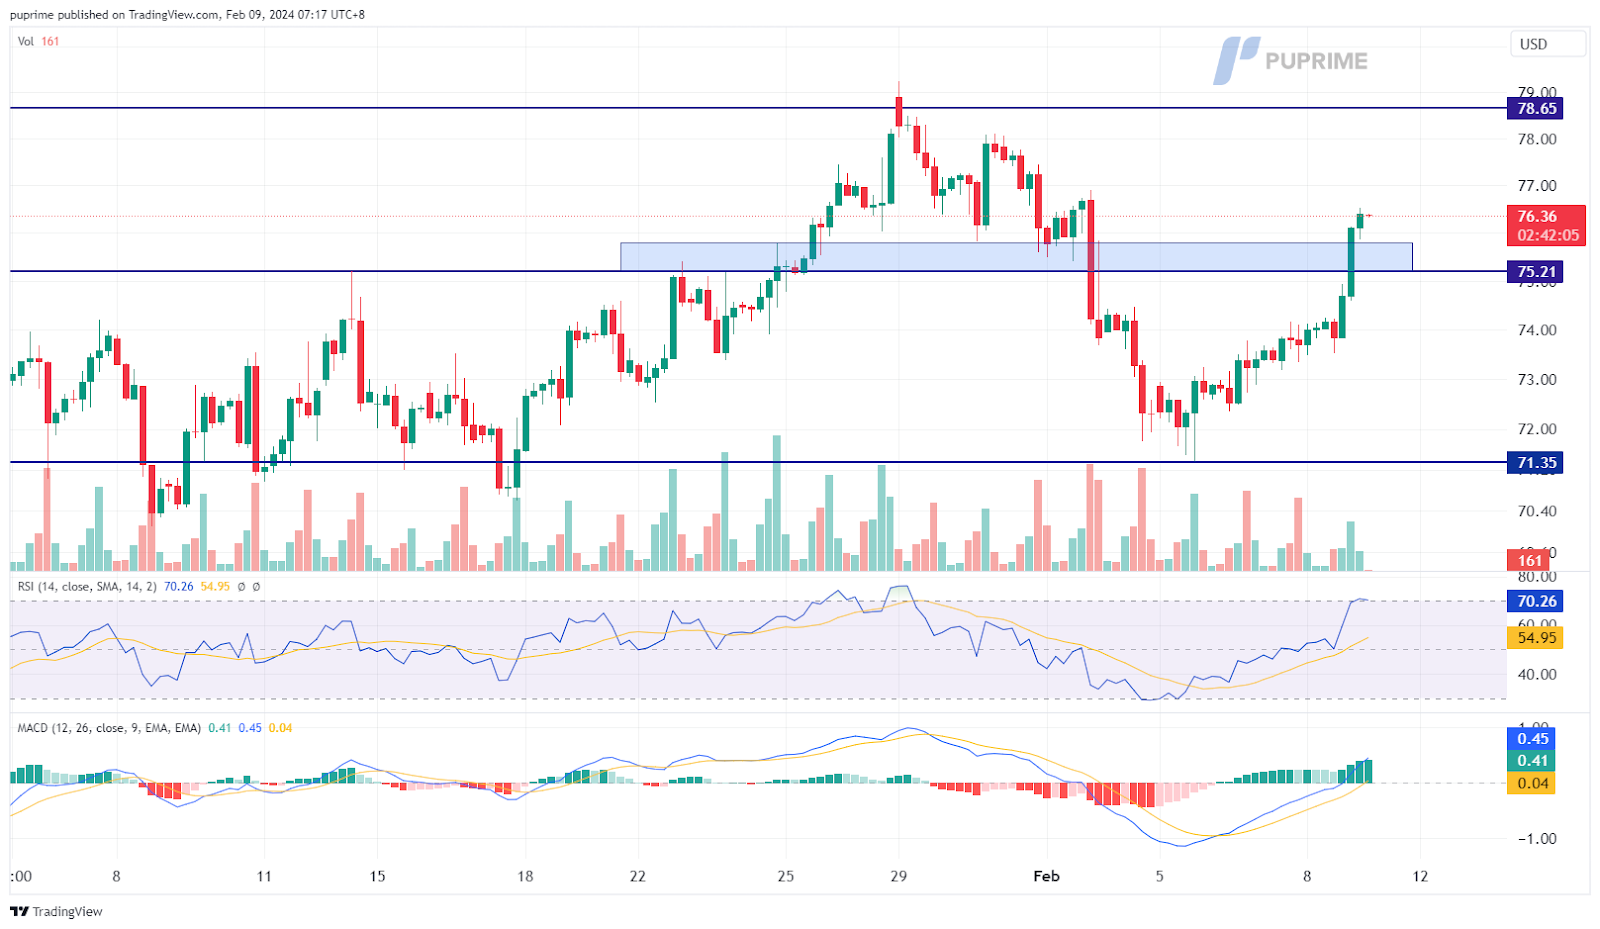
Crude oil prices exhibited strength despite a strengthened U.S. dollar, propelled by geopolitical uncertainty. Ceasefire discussions in the Middle East took a negative turn as the Israeli Prime Minister rejected the deal proposed by Hamas, deeming it delusional.
Oil prices are trading higher and have broken above their strong resistance level at near 75.2 levels, suggesting a bullish bias for oil prices. The RSI is on the brink of breaking into the overbought zone while the MACD has broken above the zero line and is diverging, suggesting the oil prices are trading with strong bullish momentum.
Resistance level: 78.60, 81.20
Support level: 75.20, 71.35

Giao dịch ngoại hối, chỉ số, Kim loại,...với phí chênh lệch thấp trong ngành và khớp lệnh nhanh như chớp
Đăng ký Tài khoản Live PU Prime với quy trình đơn giản của chúng tôi
Dễ dàng nạp tiền vào tài khoản của bạn với nhiều kênh nạp tiền và loại tiền tệ được chấp nhận
Truy cập hàng trăm công cụ trong điều kiện giao dịch hàng đầu thị trường
Nền tảng giao dịch
Đào tạo
Công ty
FAQs
Ứng dụng PU Prime - Bắt đầu Giao dịch với một lợi thế


Risk Warning: Trading Contract for Difference (CFD) carries a high level of risk to your capital and may result in losses that exceed your deposits due to leverage. It's important to understand how CFDs work and assess whether you can afford the high risk of losing your money. When acquiring our derivative products, you do not own or have rights in the underlying assets. Past performance is not indicative of future results. The information on this website is general and does not take into account your personal objectives, financial circumstances, or needs. Seek independent advice from qualified experts if necessary, and ensure you fully understand the risks before making any trading decisions.
PU Prime is a brand name of different entities authorised and registered in various jurisdictions.
PU Prime Limited is authorized and regulated by the Financial Services Authority of Seychelles under License No. SD050, with registered address at CT House, Office 1A, Providence, Mahe, Seychelles.
PU Prime Ltd is authorized and regulated by the Financial Services Commission of Mauritius under License No. GB23202672, with registered address at Suite 201 Level 2, The Catalyst Building, 40 Silicon Avenue, Cybercity Ebene, Mauritius.
PU Prime (Pty) Ltd is an authorised Financial Services Provider registered and regulated by the Financial Sector Conduct Authority of South Africa under License No. 52218, with registered address at 37 Harley Street, Ferndale, Randburg, Gauteng, South Africa.
The information on this website is not intended for residents of certain jurisdictions, including the United States, Singapore, Australia, China, Russia, and jurisdictions listed on the FATF and EU/UN sanctions lists. It is not intended for distribution or use where such distribution or use would be contrary to local law or regulation. While the Authority has granted a securities or derivatives investment business licence to the Licensee, it does not endorse the products offered.
Finzero Cap Ltd, registered in the Republic of Cyprus with registration number HE414308 and registered address at 62 Athalassas, Mezzanine, Strovolos 2012, Nicosia, Cyprus.
Copyright © 2024 PU Prime.

Please note the Website is intended for individuals residing in jurisdictions where accessing the Website is permitted by law.
Please note that PU Prime and its affiliated entities are neither established nor operating in your home jurisdiction.
By clicking the "Acknowledge" button, you confirm that you are entering this website solely based on your initiative and not as a result of any specific marketing outreach. You wish to obtain information from this website which is provided on reverse solicitation in accordance with the laws of your home jurisdiction.
Thank You for Your Acknowledgement!
Ten en cuenta que el sitio web está destinado a personas que residen en jurisdicciones donde el acceso al sitio web está permitido por la ley.
Ten en cuenta que PU Prime y sus entidades afiliadas no están establecidas ni operan en tu jurisdicción de origen.
Al hacer clic en el botón "Aceptar", confirmas que estás ingresando a este sitio web por tu propia iniciativa y no como resultado de ningún esfuerzo de marketing específico. Deseas obtener información de este sitio web que se proporciona mediante solicitud inversa de acuerdo con las leyes de tu jurisdicción de origen.
Thank You for Your Acknowledgement!
